Remarkably, this week's tip was initially inspired by the Guinness Brewery in Dublin, Ireland. In his new book Statistical Analysis for Business Using JMP, Professor Willbann Terpening provides lots of useful information - including the origin and usage of the Student t-distribution.
If you'd like to get to know Willbann and his work better after reading the featured excerpt below, visit his author page. You'll find a free chapter from the book, JSL Scripts and instructions, and powerpoint slides. Cheers!
The following excerpt is from SAS Press author Willbann D. Terpening and his book "Statistical Analysis for Business Using JMP: A Student's Guide" Copyright © 2011, SAS Institute Inc., Cary, North Carolina, USA. ALL RIGHTS RESERVED. (please note that results may vary depending on your version of SAS software)
The Student t-Distribution
The Student t-distribution, or more simply the t-distribution, arose in response to a common business application of quality control at the Guinness Brewery in Dublin, Ireland. The distribution was developed by William S. Gossett for his work with small samples at the brewery. Because the company regarded his work as proprietary, when he published his work in 1908, he used the pen name Student, hence the name Student t-distribution.
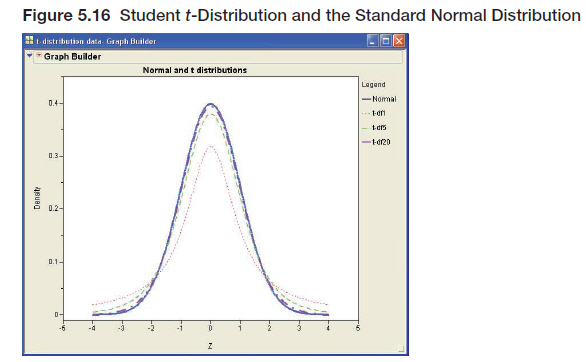
The t-distribution is very closely related to the standard normal distribution and, like the normal, is a symmetric bell-shaped distribution. Like the standard normal, it is centered at zero and can be positive or negative. The t-distribution, however, has a standard deviation that is generally larger than 1.0, the standard deviation of the standard normal distribution. The t-distribution has a single parameter, degrees of freedom (df). The degrees of freedom are directly related to the size of the sample. As the degrees of freedom increase, the t-distribution becomes more and more like the standard normal distribution.8 Figure 5.16 shows several t-distributions for various degrees of freedom along with the standard normal distribution for comparison. You can see that the t-distribution is “fatter” than the standard normal distribution (has a larger standard deviation) when the degrees of freedom are small (df = 1 or df = 5) but becomes more and more like the normal distribution as the degrees of freedom increase. For df = 20, the two curves are hard to distinguish.


3 Comments
Pingback: SAS author’s tip: The concept of a sampling distribution - The SAS Bookshelf
Hi Mike, I'm so glad you liked our most recent tip! Unfortunately, I can't take credit for writing the tip. The tip was excerpted from Willbann Terpening's book "Statistical Analysis for Business Using JMP".
Well-written, Shelly. You took something that is complex (for me) and made it clear!